Ah, the terms 52-week high and 52-week low might sound like the grades you got in school, but in the stock market, they mean something entirely different. Let’s break it down in a fun and simple way!
What is a 52-Week High? 📈
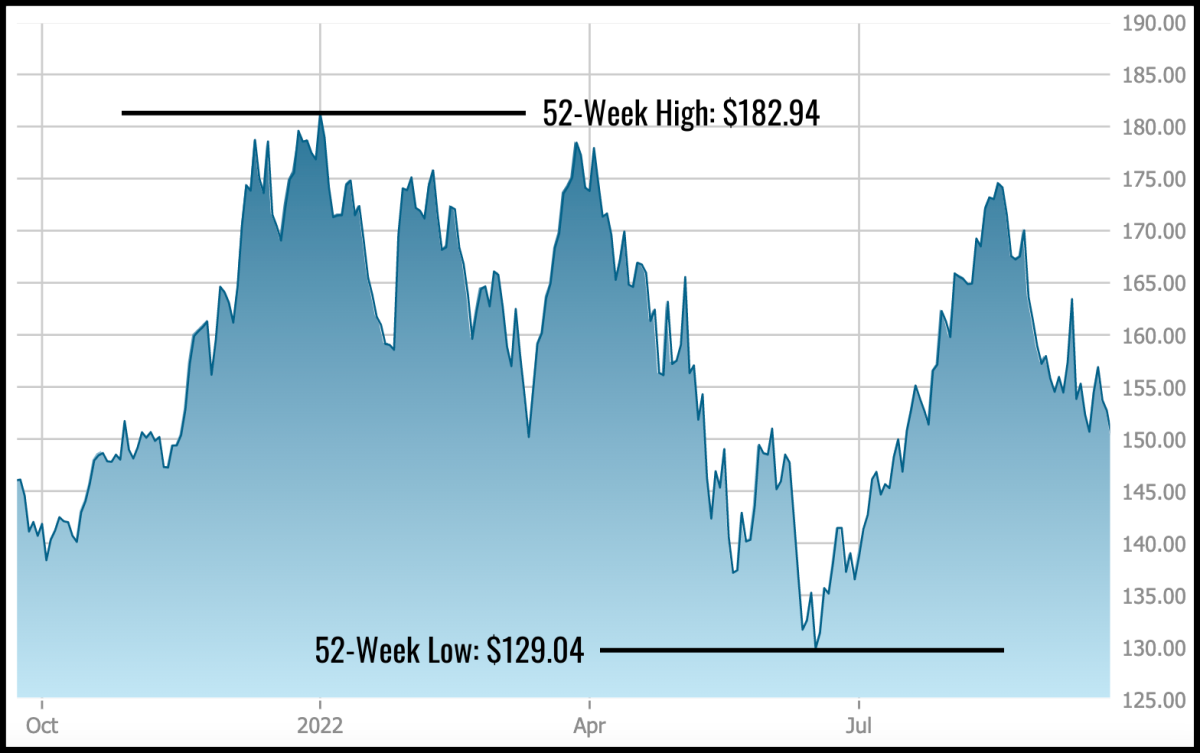
This is the highest price a stock has reached in the last 52 weeks (a year, basically). Think of it as the stock’s "career-best performance"—its Virat Kohli moment! 🏏
- Imagine you’re a stock. If your price hits ₹200 in the past year but never went higher, that ₹200 is your 52-week high.
- Investors see this as a sign of strength, like a “Best Actor” award for the stock. But, just like in Bollywood, a high can be followed by a flop. So, it’s not the only thing to consider.
What is a 52-Week Low? 📉
The 52-week low is the lowest price a stock has fallen to in the last year. This is like your "rock-bottom phase", the one we all have when we cry over chai and pakoras during a rainy day. ☔🍵
- For example, if your stock hit ₹50 at its lowest in the past year, that’s its 52-week low.
- Some investors see this as a bargain deal—like buying winter clothes in April when prices are slashed. But remember, cheap doesn’t always mean good. That ₹2000 jacket might still have a broken zip!
Why Does it Matter?
Knowing a stock’s 52-week high and low is like knowing the range of a cricket score. It tells you:
- How volatile the stock is: Is it playing safe like Rahul Dravid or swinging wildly like Rishabh Pant?
- Potential opportunities: A stock near its 52-week low might seem like a discount, while one near its high might feel expensive.
Real-Life Example:
Let’s say Tata Tea Ltd has a:
- 52-week high of ₹500
- 52-week low of ₹300
This means:
- ₹500 is the highest price the stock touched in the last year. At this point, investors were probably saying, “Ab aur upar jayega kya?” (Will it go higher now?).
- ₹300 is the lowest price, when others were nervously whispering, “Bas, ab toh band baja!” (That’s it, it’s doomed!).
A Funny Analogy:
Think of stocks like Bollywood actors:
- The 52-week high is their blockbuster hit—when everyone is clapping, and the stock is shining like a star on the red carpet. 🌟
- The 52-week low is their flop era—when they’re hiding from the paparazzi and waiting for their big comeback. 😅
As an investor, you need to decide whether the star is still shining or if it’s time to move on to the next hit.
Final Words:
The 52-week high and low give you a snapshot of a stock’s journey over the past year. It’s not a guarantee of future performance, but it’s like checking the IMDb rating before watching a movie—it helps you make better decisions.
So, the next time you see these numbers, don’t panic. Just ask yourself: Is this stock giving me blockbuster vibes or clearance sale energy? And invest wisely! 🎬📊


No comments:
Post a Comment